Blog · Gen4AVC @ ECCV 2026
We audited the four AV-sync metrics everyone uses. They don’t agree.
A reliability audit of AV-Align, ImageBind, JavisScore and Synchformer for audio-visual generation. No metric wins both timing and perception.
Originally published on Medium
If you work on video-to-audio or joint audio-video generation, you’ve probably reported at least one of these four numbers: AV-Align, ImageBind AV-relevance, JavisScore, or Synchformer/DeSync. Most likely you reported whichever one the paper you were comparing against had used.
We ran all four through the same set of reliability tests. The results were messier than I expected, and I think they should change how people report sync numbers.
The paper is here, accepted as a poster at the Gen4AVC workshop at ECCV 2026.
01
Why we bothered
The field already half-suspects this. JavisScore was introduced partly because AV-Align “may produce misleading results” on complex scenes. So people know individual metrics have failure modes. What nobody had done was put the whole deployed set through one common protocol and see how they compare.
There’s also a newer reason to care. Sync scores aren’t just leaderboard decoration anymore; preference-optimization pipelines now train on them. If your reward signal is noisy, or is measuring a different thing than you think, you’re not just misranking models at the end, you’re steering the model in the wrong direction during training.
02
The annoying part: there’s no ground truth
To check whether a metric is right, you’d normally need human ratings of how well-synced a bunch of clips are. That’s an expensive annotation study, and we didn’t have one.
The workaround is to break clips on purpose. Take videos that are already well synced, then damage them by a known amount: shift the audio later and later, speed it up more and more, chop it into fragments and shuffle them, mute random chunks. You still don’t know the “true” sync quality of any clip. But you know for sure that the version you damaged more should score worse than the version you damaged less. That gives you an ordering to check against, for free.
We used AVSync15 for this (75 clips for the main audit, 5 from each of 15 classes, with a 150-clip rerun to make sure nothing hinged on sample size), plus three other tests:
- Crop the clip slightly, which shouldn’t change sync at all, and see whether the score moves anyway.
- Check whether the four metrics agree with each other on the same clips.
- Compare each one against PEAVS, a metric trained on 120K human opinion scores. It’s a stand-in for human judgment, not human judgment itself, which matters for how much weight to put on that axis.
03
What we found
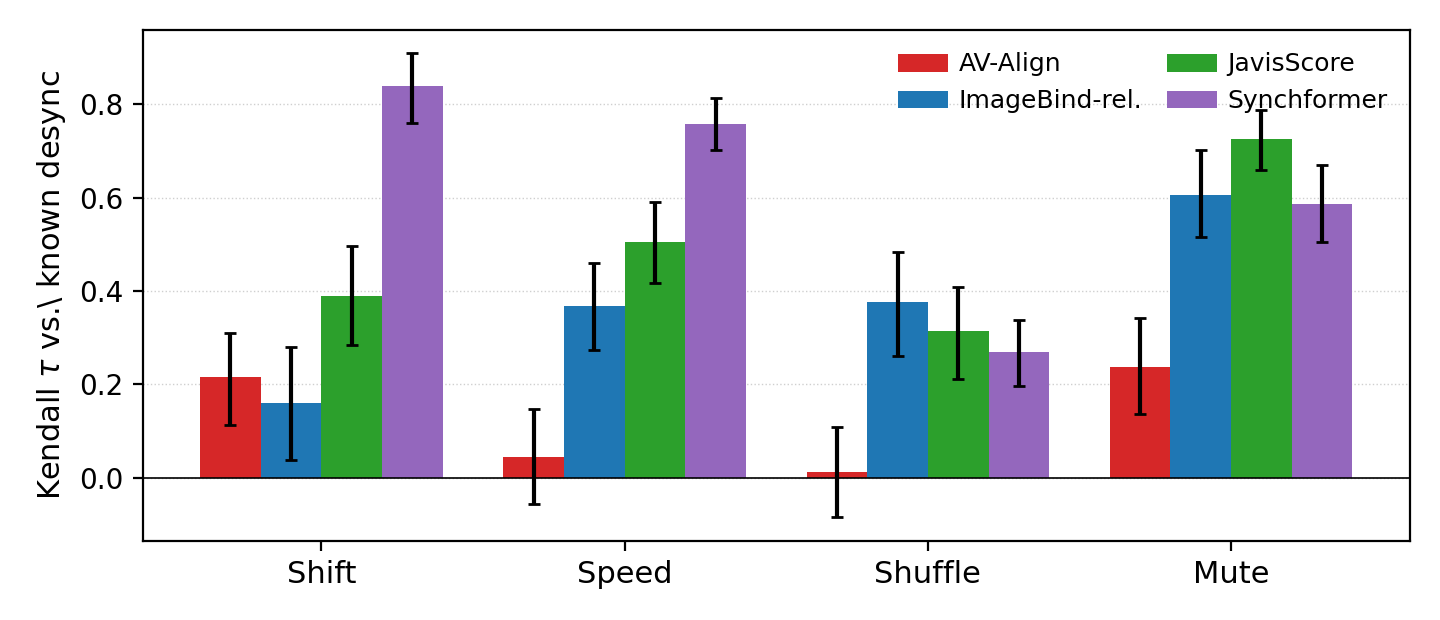
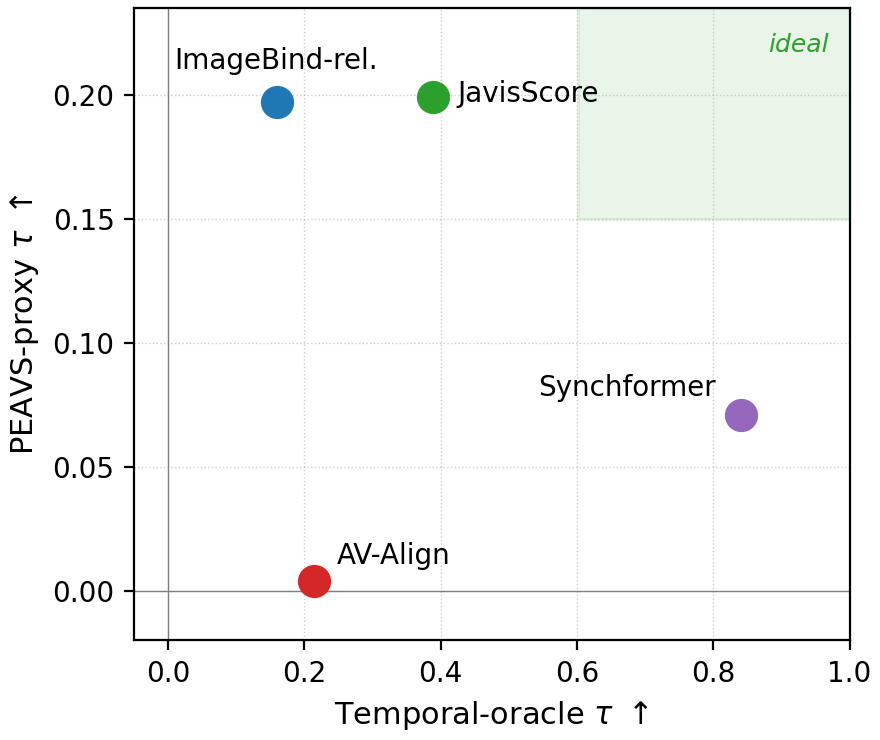
Synchformer is a good clock and a bad critic. It’s genuinely excellent at noticing a shifted soundtrack: 0.84 on a 0-to-1 agreement scale, where the other three land between 0.16 and 0.39. It was also the only metric where the gap between adjacent damage levels was bigger than the clip-to-clip noise. But on agreement with the human-aligned proxy it comes in nearly last, at 0.07, versus 0.20 for ImageBind and JavisScore. And when the damage isn’t a clean timing shift (audio chopped and shuffled, or randomly muted), the embedding metrics beat it.
So the metric that’s best at timing is one of the worst at matching perception. That’s not a ranking of good-to-bad metrics, it’s two different measurements wearing the same label.
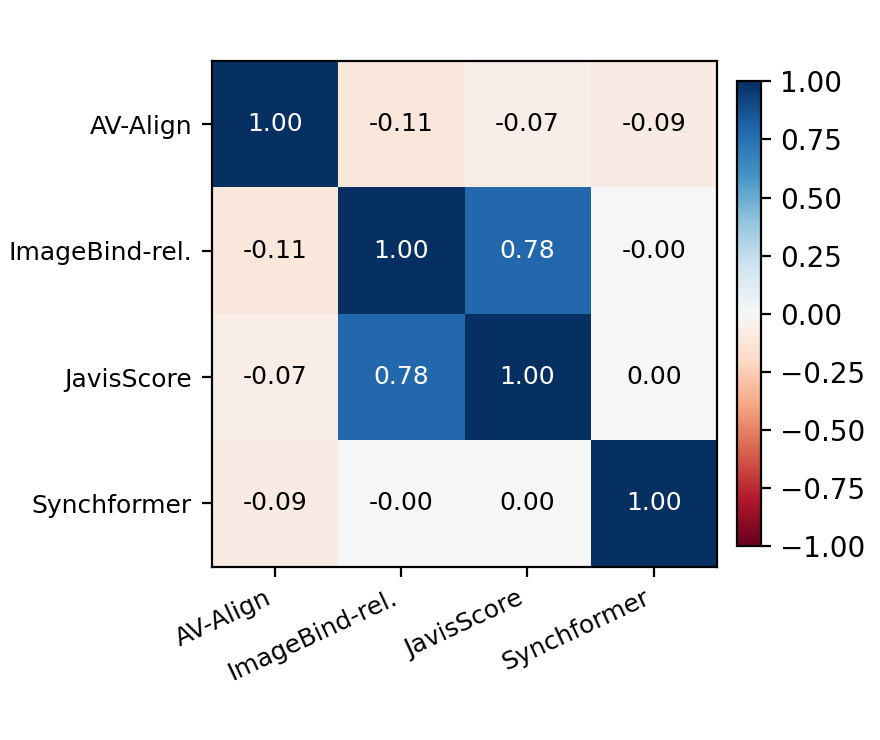
The four metrics barely agree with each other. Treating each metric as a judge scoring the same clips, agreement across the four came out at 0.066, on a scale where 1.0 is perfect. The human annotators in the PEAVS study agreed with each other at about 0.71. The only pair that agrees well is ImageBind and JavisScore (0.78), and they agree because JavisScore is built on top of ImageBind, so that’s really one opinion counted twice. A PCA says the four metrics span three roughly independent directions, which is an awkward thing to collapse into a single number.
Close model comparisons are where this actually bites you. This is the result I’d most want people to take away. We generated audio for 45 videos using three MMAudio checkpoints, then asked each metric to rank them. When two models were far apart in quality, every metric got the ordering right. Fine. But when two models were close, which is the normal situation on a leaderboard, three of the four metrics flipped the ordering about a third of the time under resampling. Only Synchformer stayed reliable, at 8%.
Put bluntly: if your new model beats the previous one by a small margin on one of these metrics, that margin may not survive rerunning the evaluation on a different sample of clips.
AV-Align is the weakest of the four. Close to no response to audio speed changes (0.04) or shuffling (0.01), 0.00 against the human-aligned proxy, and the only metric whose score swings around when you merely crop the clip (coefficient of variation 0.54 against 0.15 or less for everything else). We were nervous this was our reimplementation’s fault, so we reran it through the original TempoTokens code. Same conclusions.
Averaging them didn’t help. The obvious response to “your four metrics disagree” is to fuse them into one better score. We tried a ridge regression and a simple k-NN combiner, evaluated out-of-fold, and neither beat the best single metric at matching the human-aligned proxy. I want to be careful here: those are two simple combiners, not a proof that fusion is hopeless. One of our reviewers pointed out that a gradient-boosted or lightly supervised combiner would be a stronger test, which is fair, and it’s on the list.
04
What we suggest doing instead
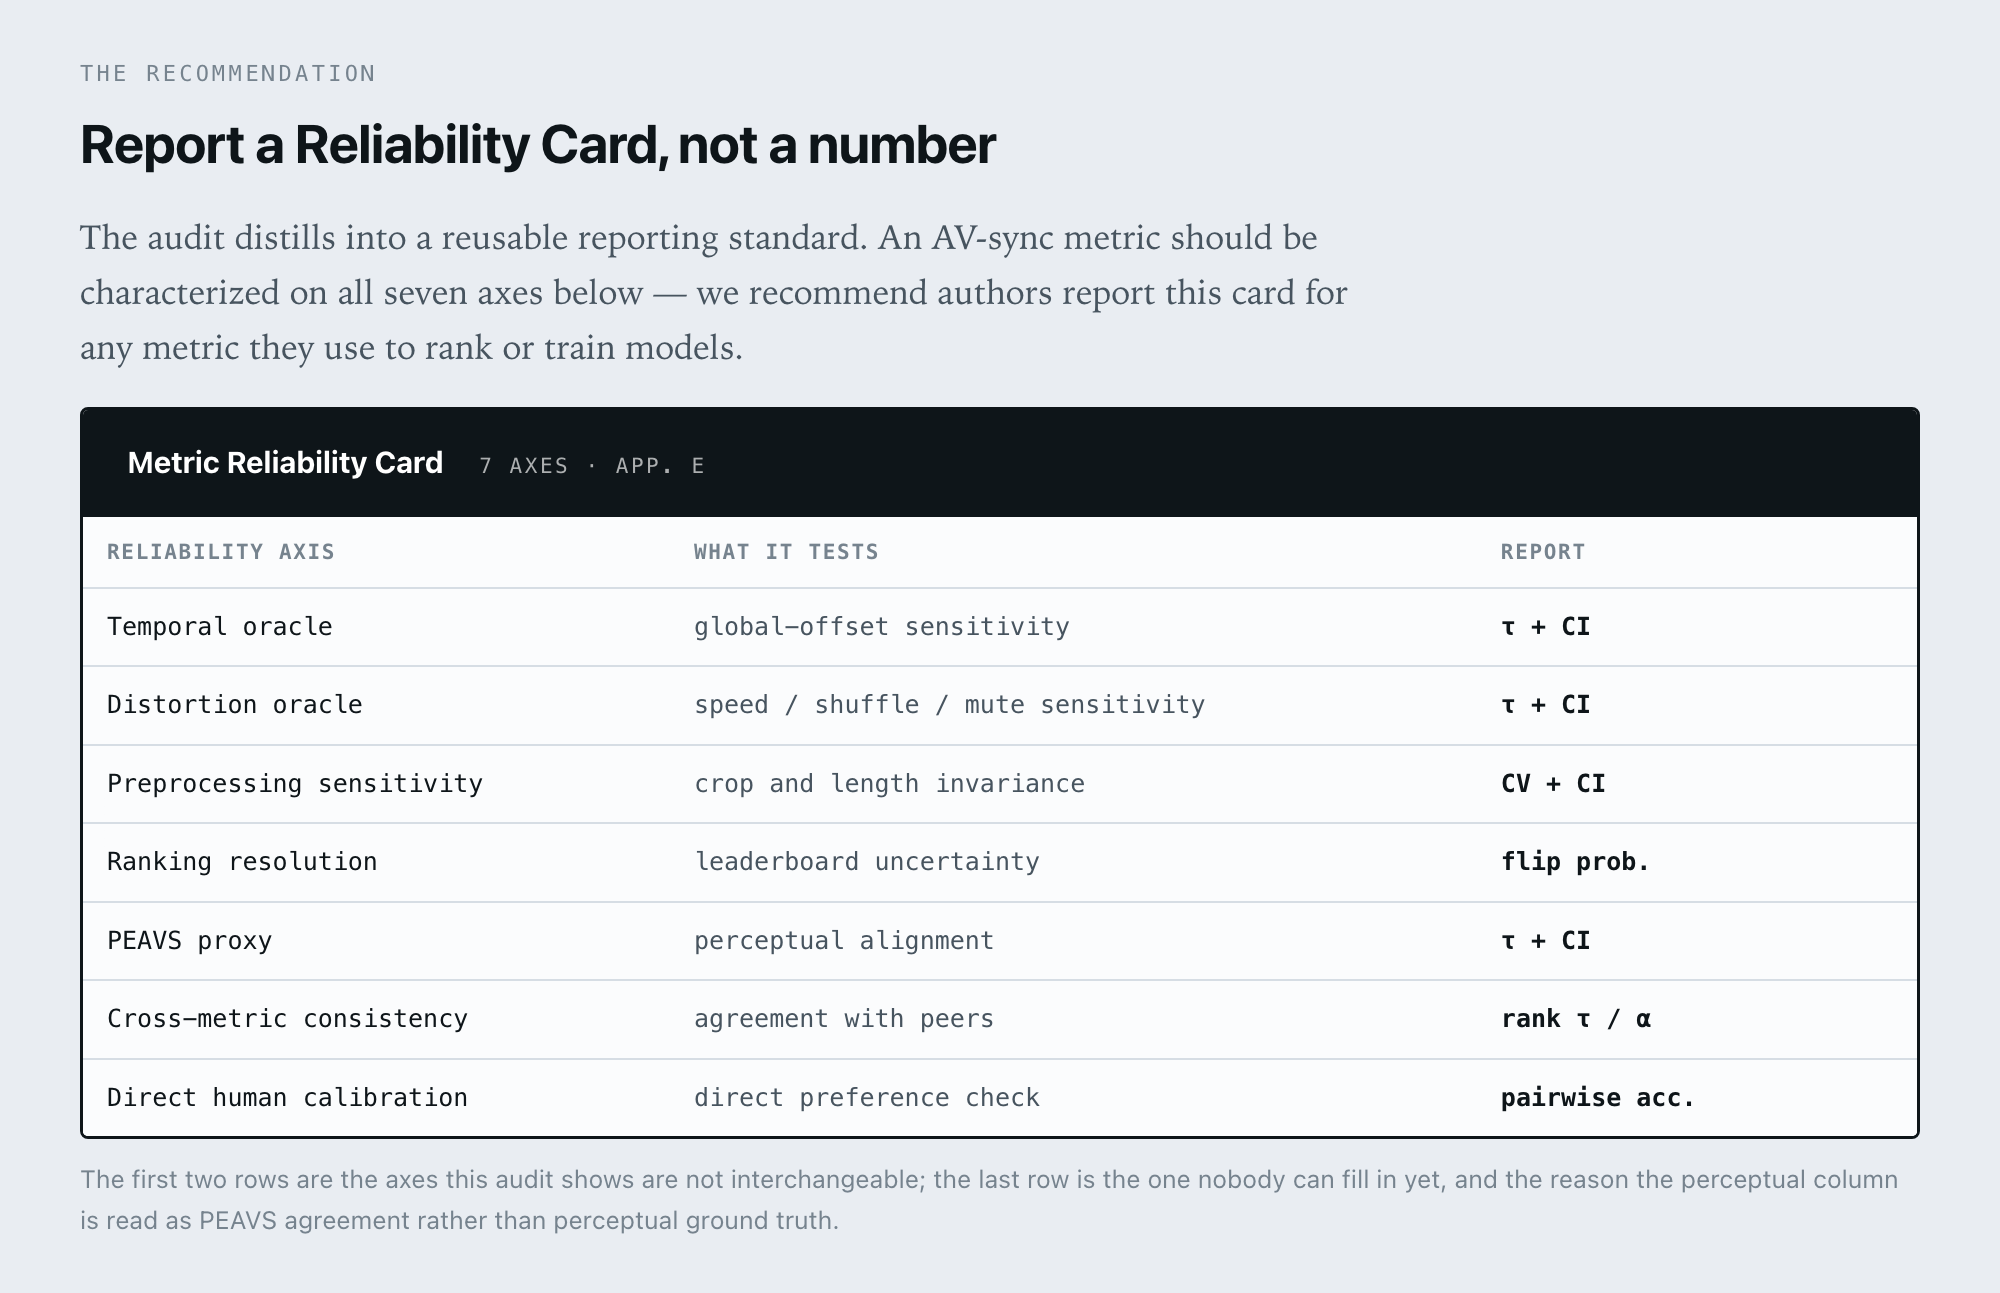
Not “use metric X.” The whole point is that which metric is right depends on what you’re trying to measure. What we’re proposing is a Reliability Card: report the metric you used along with how it behaves on seven axes rather than as one bare score.
- Temporal oracle. Does it notice a shifted soundtrack?
- Distortion oracle. Does it notice speed changes, shuffling, muting?
- Preprocessing sensitivity. Does the score hold still when nothing meaningful changed?
- Ranking resolution. How large does a gap have to be before it’s real?
- Perceptual agreement. Does it track human-aligned judgment?
- Cross-metric consistency. Does it agree with the other metrics?
- Human calibration. Does it match actual human preference, if you have labels?
If you want three practical rules instead:
- Don’t report AV-Align on its own. It was the weakest and least stable metric in every test we ran.
- If you specifically care about timing, Synchformer/DeSync is the one to use, as long as you don’t also read it as evidence the result feels right to a person.
- Put uncertainty on the number. If you can’t show your gap is larger than the noise, don’t claim the win.
05
What this doesn’t show
The main audit is 75 clips from AVSync15, which is curated and not very diverse. We reran the oracle on 75 in-the-wild VGGSound clips and the ordering held, with lower absolute numbers, but “the ordering held on a second dataset” is not the same as “this generalizes everywhere.”
The perceptual axis leans on PEAVS, which is a learned model, not people. It may share representational biases with the embedding metrics, which would inflate their agreement with it. Getting real human preference labels is the obvious next step, and until someone does that, treat that column as “agreement with PEAVS” rather than “agreement with humans.”
And the damage we impose is synthetic. Real generative artifacts don’t look like a clean 200ms shift. The MMAudio experiment covers some of that gap, but not all of it.
06
Links
- Project page, with all the numbers jaishrm07.github.io/avsync-reliability-card/
- Paper (PDF) jaishrm07.github.io/avsync-reliability-card/static/paper.pdf
- OpenReview, including the reviews openreview.net/forum?id=z84NDA7WHH
Every number in this post, with confidence intervals, the full protocol, the robustness reruns and the Reliability Card specification, is in the paper and on the project page.
What Do Audio-Visual Synchronization Metrics Actually Measure? by Jai Kumar Sharma (Virginia Tech) and Peeyush Tapadiya (Accenture). Happy to talk about any of this: jaisharma@vt.edu. This post was originally published on Medium.
@misc{sharma2026avsync,
  title        = {What Do Audio-Visual Synchronization Metrics Actually Measure?},
  author       = {Sharma, Jai Kumar and Tapadiya, Peeyush},
  year         = {2026},
  howpublished = {Gen4AVC Workshop at ECCV 2026},
  note         = {Workshop poster}
}